
In addition to the initial, out-of-the-box benefit of a 97% reduction in CVEs and a far fewer rate of new vulnerabilities being added (a longer MTTC), minimal images have a third key advantage over their public counterparts: quicker vulnerability remediation time. To measure this, we look at Mean Time to Remediation (MTTR).
When a new vulnerability is disclosed, several things must happen before it is resolved in a container image:
Mean Time to Remediation measures the time between step one and step four. In other words, it measures how long users remain exposed to a vulnerability after it becomes publicly known.
This is why MTTR is an important metric alongside CVE counts and MTTC: it helps security teams understand how quickly vulnerabilities actually disappear from the images they deploy.
In traditional container image ecosystems, these steps to remediation can take weeks or months. Image maintainers may wait for upstream distribution releases, bundle multiple changes into infrequent rebuilds, or prioritize other updates before shipping patched images. Upstream distributions such as Debian and Alpine generally choose to delay updates that fix lower-severity vulnerabilities until the next major release (which may be six months to two years away).
Minimal image pipelines that build all packages from source code are designed to shorten this window. Because the packages are updated as soon as the upstream project fixes the vulnerability, and because rebuilds are automated and frequent, fixes can be incorporated and published much faster.
An image’s MTTR is calculated by generating every SBOM across an image line and examining the first version of an image that contains a fixed package. For public images, this means identifying the last vulnerable image and finding the next release as fixed. In practice, this is straightforward because public image maintainers typically publish a new version for each update, allowing you to compare sequential releases such as 1.1.5, 1.1.6, and 1.2.0.
For Minimus images, the process is slightly different. Rather than relying on version bumps, Minimus continuously releases updated digests for the same version as fixes become available. This means there may be multiple releases of the same version of the hardened container image (for example, several 1.1.5 digests), each incorporating additional CVE fixes over time. MTTR is therefore calculated by identifying the earliest image version that contains the fixed version found in the advisories digest.
Let’s dive into MTTR by examining the nginx web server image:
High severity vulnerability CVE-2022-23308 was published on 2022-02-26. This CVE was resolved in the 1.21.6 release of the image on 2022-05-29. We subtract the CVE’s published date from the push date of the fixed image, 2022-05-29 and 2022-02-26, giving a time difference of 92 days.
These times are averaged together to give the final MTTR of 277 days.
(Of course, higher risk vulnerabilities tend to be fixed more quickly; filtering out low and medium severity CVEs leads to a much lower MTTR of 185 days.)
The process for calculating Minimus images’ MTTR is analogous but slightly different.
The Minimus digest lists gosu version 1.17-r4 as containing a fix for CVE-2025-22874. On 2025-06-16, Minimus released new digests for postgres version 17.5 (as well as 16.9, 15.13, and other versions major versions) upgrading the package.
With the CVE’s published date of 2025-06-11, this gives a time to remediation of 4 days. Averaging across all vulnerabilities that have been fixed in Minimus postgres digests gives an MTTR of 15 days.
To make these differences more concrete, the table below compares MTTR across representative public and Minimus images.
Across these images, the gap is consistent: public images measure remediation in months, while Minimus reduces that window to days, delivering dramatically faster remediation and more predictable timelines.
This is particularly notable when combined with the increase in MTTC for these images. For example, in the nginx image, the public Docker Hub image sees a new CVE about every 4 days while the Minimus nginx image sees a new CVE about every 33 days, and those CVEs are remediated 99% faster in the Minimus image when they do occur.
That’s a powerful combination that allows organizations to focus more on running nginx and less on patching it…and, when a fix is needed, to deliver it to production much faster.
It’s important to understand how MTTR behaves as a metric. In real-world datasets, remediation times are not evenly distributed. A small number of vulnerabilities can remain unpatched for extremely long periods, which skews the average upward.
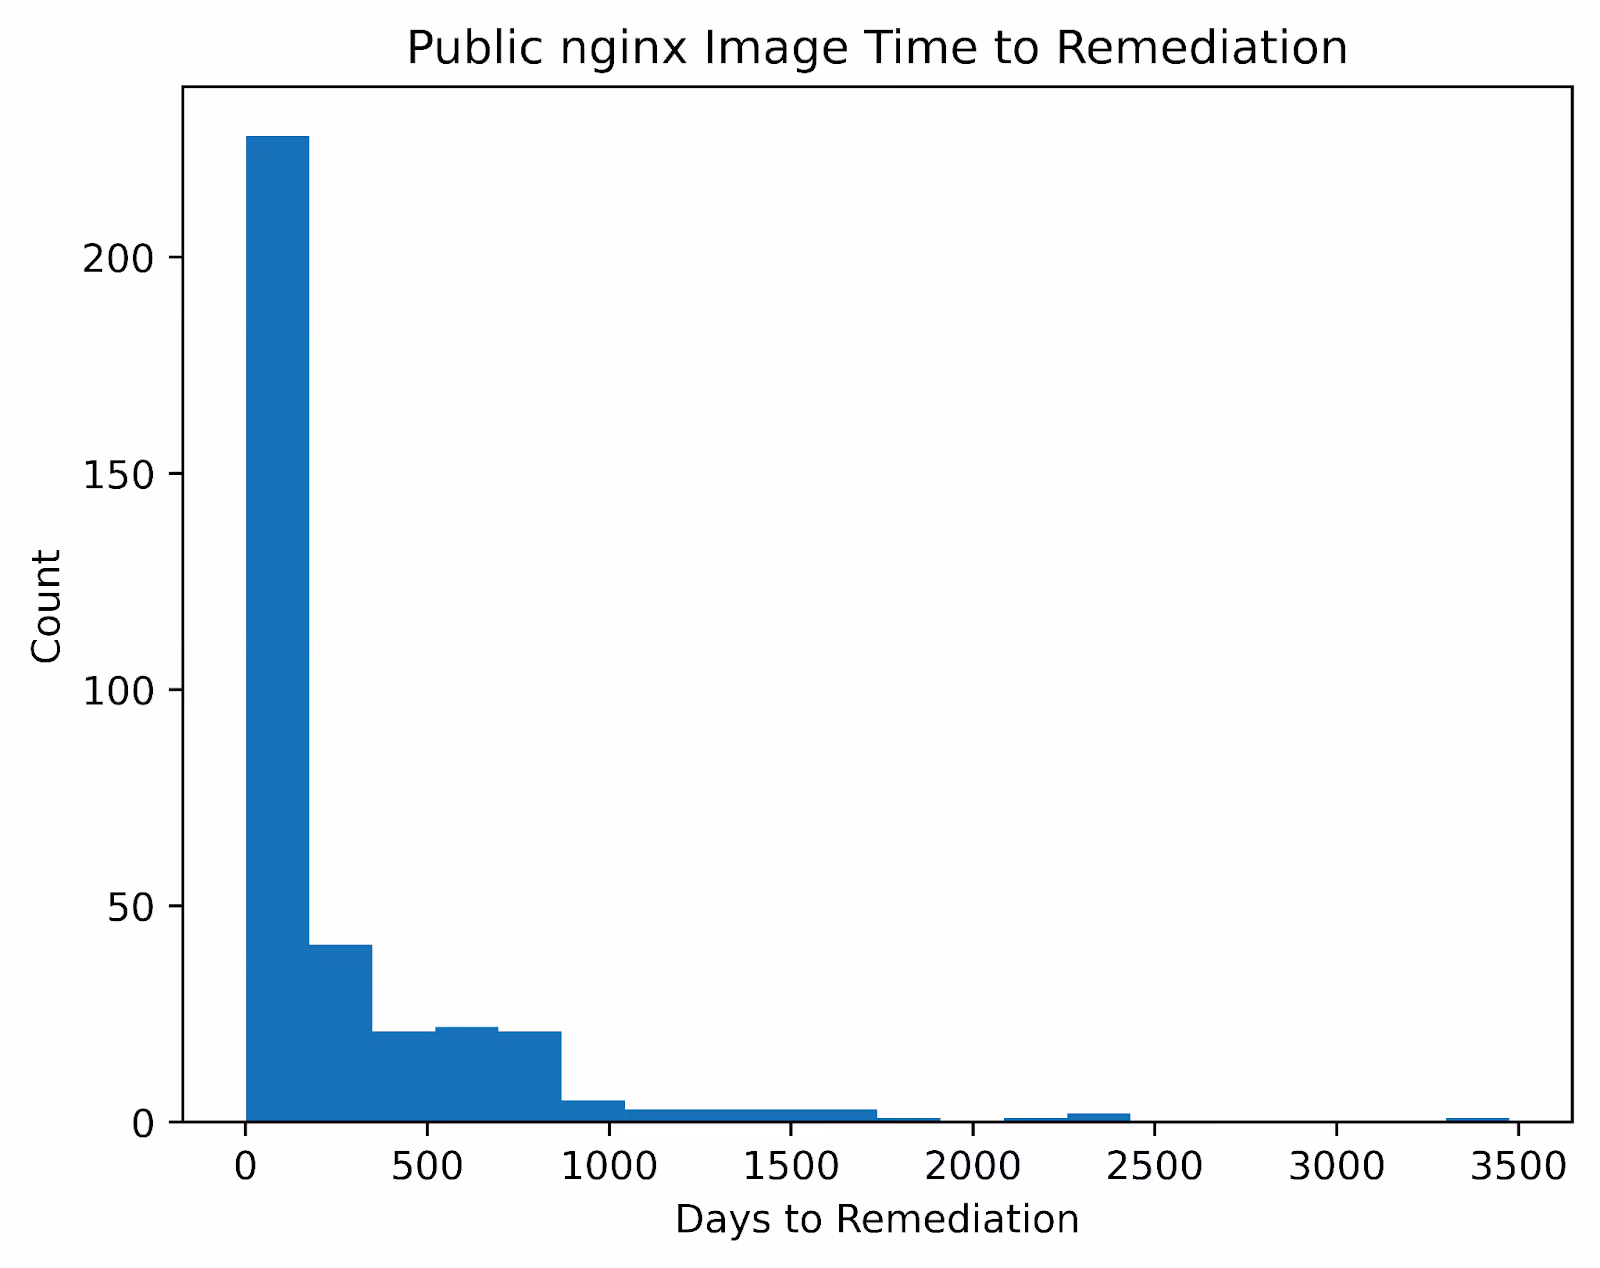
We can examine the mean time to remediation of the public nginx image graphically. The distribution below demonstrates how a few outliers drive the average remediation time up.
The most extreme example, CVE-2013-0340, was present in nginx 1.25.0 and prior versions, but not in 1.25.1. Its published date of 2014-01-21 subtracted from nginx 1.25.1’s release date of 2023-06-13 gives a time to remediation of over nine years.
There are only 17 vulnerabilities with a TTR of over 1000 days, and dropping them from the calculation brings the MTTR down from 277 days to 205. The median time to remediation is only 119 days, less than half of the mean, which better reflects the typical remediation experience.
Even adjusting for outliers, you can see that public image remediation is both slow and inconsistent. While some vulnerabilities are fixed relatively quickly, others persist for years, making it difficult for security teams to rely on predictable remediation timelines.
Mean Time to Remediation (MTTR) offers another lens for evaluating the security of hardened container images. Public images often take months, sometimes even years, to address known issues, leaving organizations exposed for extended periods. In contrast, Minimus hardened container images demonstrate much faster MTTR, with fixes landing in days rather than months.
For security teams, this means that using Minimus hardened container images doesn’t just reduce the number of vulnerabilities and the frequency of new ones, it also ensures that when issues arise, they’re resolved far more rapidly. Taken together, MTTC and MTTR highlight a complete picture of why minimal images deliver stronger, more predictable security outcomes compared to public images.
Ready to minimize your risk? Explore Minimus images today and see how faster remediation, fewer vulnerabilities, and stronger compliance can transform your container security program.


.svg)
.svg)


.svg)


.svg)

