
One of the most well-known benefits of minimal hardened container images is their out-of-the-box reduction in vulnerabilities compared to their public counterparts. Simply replacing a public image with one from the Minimus image gallery results in an immediate reduction of over 95% of CVEs.
But there’s another, even more crucial advantage: the decreased frequency of future CVEs. By building with minimal images, users not only reduce their vulnerabilities on day one; they also encounter far fewer new CVEs on an ongoing basis.
To measure this, we’ll look at Mean Time to CVE (MTTC), a metric that reflects how frequently vulnerabilities arise in a given image. A longer MTTC indicates that new vulnerabilities emerge less often, reducing long-term security noise and effort. Fewer ongoing CVEs means less time spent on triage, prioritization, and remediation across months and years, resulting in massive time savings across the organization.
An image’s MTTC is calculated by generating an SBOM and aggregating vulnerabilities at the package level. Every CVE, across all library versions and all applicable OSs, is included. Aggregating at the package level avoids discrepancies between different image scanners and standardizes the process.
From there, the time difference between sequential CVEs’ published dates from numbering organizations can be averaged, providing the mean time between vulnerabilities.
Let’s illustrate MTTC by looking at the nginx web server image.
First, we generate an SBOM of nginx’s latest version. Then, we search each package, along with common name variations across Trivy’s database. This is a key-value database, organized by operating systems as the top level folder and individual libraries as subfolders, so each folder is traversed and the CVEs it contains added to a common set.
From there, we aggregate the CVEs, 1256 in total, and cross-reference them with their entries in a separate details database to obtain their CNA published dates. The CVEs are sorted by these dates, and the average time delta between consecutive entries are averaged to produce the final MTTC of 7.69 days.
A similar process is repeated on the SBOM of Minimus’ image, yielding 256 total vulnerabilities with an MTTC of 32.84 days. Thus, on average, it’ll be more than four times as long before a vulnerability is found in Minimus’ image.
The vulnerabilities can be visualized graphically as well. Below are histograms of vulnerabilities that at one point affected a version of a package contained in the current public and Minimus nginx images.
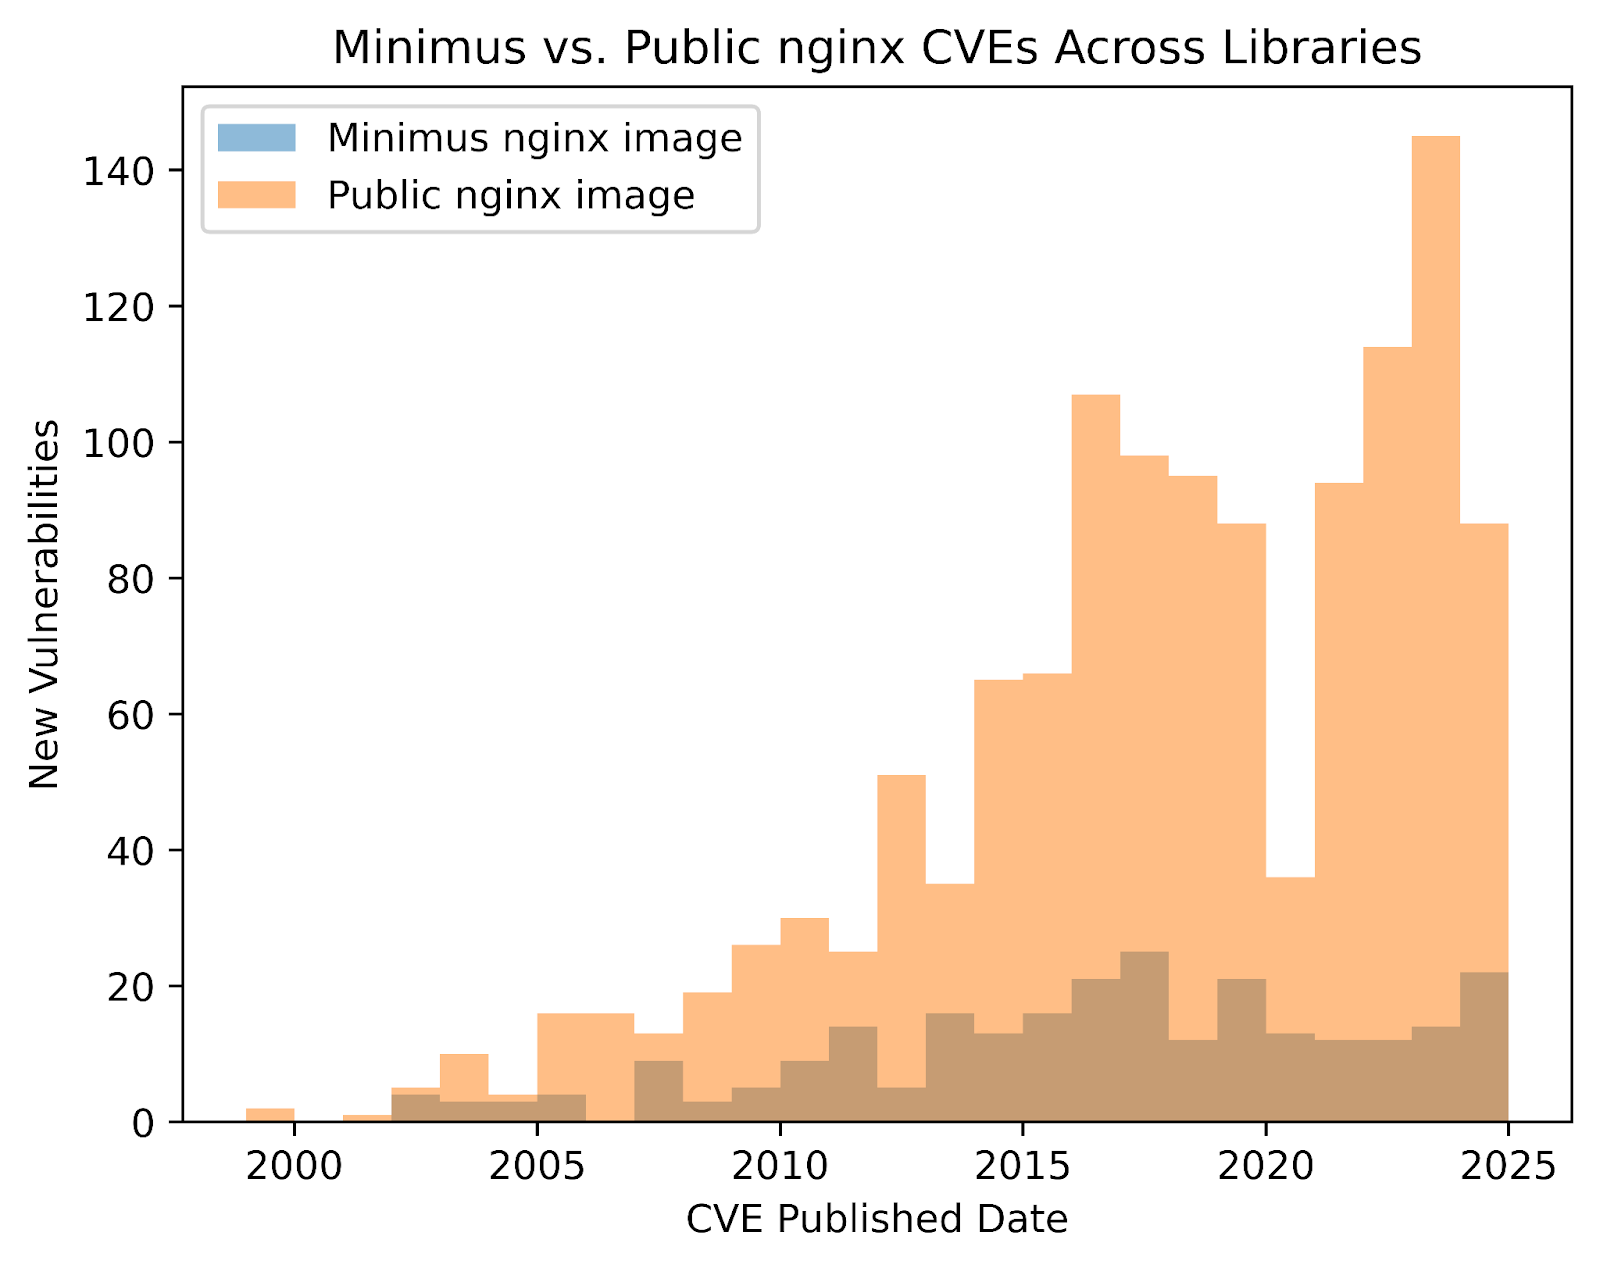
The shape of this histogram roughly mirrors the distribution of all CVEs since 1999. This illustrates that the bulk of CVEs occurred recently. Limiting the calculation to only CVEs that were published within the past 10 years drops the public image’s MTTC from 7.69 days to 4.06.
The distribution can also be broken down by package in the histogram below. Importantly, this graph contains duplicates of vulnerabilities that appear in multiple libraries, leading to a slightly different shape and larger scale.

This demonstrates that a handful of packages are significant contributors to overall image CVE count. Zooming in on the top contributor, openssl, we can examine its vulnerabilities and in a similar way.

The uptick in CVEs after 2014 reflects increased scrutiny after the infamous Heartbleed vulnerability. Applying the same process as above, we see that openssl has a MTTC of 38.80 days, meaning a single library in the public nginx image gets a CVE almost as frequently as the entire Minimus image.
Finally, we can filter CVEs by severity, filtering out low and medium risk vulnerabilities. The public image has a MTTC of 17.24 days, compared to the Minimus image’s 63.92 days. Thus, Minimus’ public image has a high or critical vulnerability 3.71 times less often than the public image.
Hardened images have three distinct advantages over those available on Docker Hub:
MTTC is an evaluation of the third, independent of total vulnerability count at any point in time or the speed at which they are patched. A longer MTTC is ultimately achieved through package reduction, minimizing the surface area for new vulnerabilities to appear. Ultimately, MTTC of an image serves as a useful indication of past CVE frequency and an insightful prediction of future risk exposure.


.svg)
.svg)


.svg)


.svg)

